In an earlier article, I explored the target market for SDG Games, and in the process I came up with a rough market sizing. That was important to make sure that I was identifying an initial market that was big enough to matter, but specific enough to ensure that we could focus on real specific needs of real people. Today, I want to start building the market sizing for potential investors. Investors care about the initial market, but they also want to understand “how big is big” — what could happen if the product and company really take off.
A common way that startups explain market sizing to potential investors is by talking about it at three levels:
- Total Addressable Market (TAM): The total market for your type of product.
- Serviceable Addressable Market (SAM): The portion of the TAM that your business can realistically serve. This might be constrained for example by geography or specialization.
- Serviceable Obtainable Market (SOM): The portion of the SAM that you might actually be able to obtain. This is a reasonable revenue goal for your business given your capabilities, other competitors, and the needs of the market.
When talking about exciting new opportunities, many of us like to grab hold of big market numbers mentioned by market research firms. Often these numbers come from research reports that the firms are hoping to sell for thousands of dollars. Each company has its own methodology for sizing the market and may even have its own definition for the market. Without buying the report, you probably can’t know whether the market they are describing is the one that you’re going after.
Even so, the most common market sizing mistake that entrepreneurs make is to say something like “the mobile app market is $200B and rapidly growing; if we just got 1% of that, we could grow our startup to a multi-billion dollar business”. A statement like that will likely ruin your chances to raise money from any experienced investor. It shows a lack of understanding of the complex mobile app market and a lack of appreciation for the detailed challenges involved in building a multi-billion dollar business.
In my opinion, the best approach is to build the market sizing bottom-up. For TAM and SAM, how many potential buyers are there and how much are they likely to pay? Multiply those two numbers together and you have the market size. For the SOM — what steps are you going to take to reach the addressable market? Given that plan and competitive realities, what share of the SAM could you reasonable achieve?
So, how does that apply to SDG Games?
Even though I don’t see value in using top-down market numbers from research firms in planning and fund raising, I still like to seek them out as a sanity check. If our bottoms-up numbers are bigger than the market sizing from industry experts, then we know that something is wrong with how we are thinking about the market.
A quick Google search uncovers four very different market forecasts:
- Grand View Research estimates that the global playing card and board game market will reach $22B by 2025.
- Arizton estimates that the global board game market will reach $30B by 2026.
- Statista estimates that the global board game market will reach $10B in 2021.
- Pipecandy estimates that the global board game market was $13B in 2019, with $4.4B of that in North America (primarily the U.S.).
This tells me that if any of our estimates exceed $10B for 2021 (the most conservative estimate), we should challenge our own calculations.
Pipecandy’s North American estimate can also give us a sense for spending per household. If the U.S. market is $3B, and (according to Statista) there were 83M families in the U.S., then each family spent, on average $36 on board games (some spent more and some less).
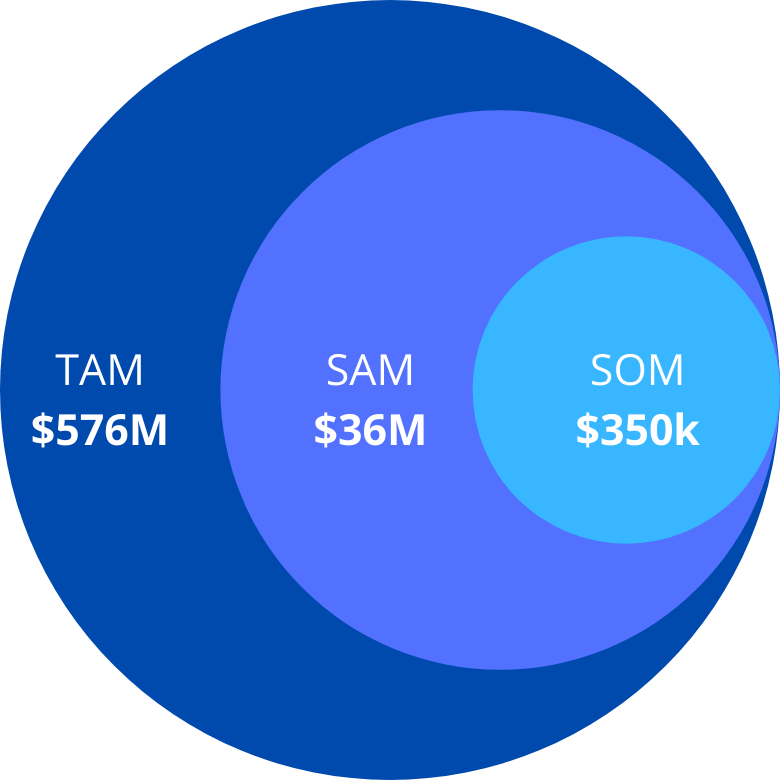
Since SDG Games’ mission is “to help Christian families connect more deeply with the Word through entertaining games”, then we will define the Total Addressable Market as the spending on board games by Christian families in the U.S. Specifically, we will limit the TAM to be households with children in the home. We previously calculated this to be 16 million households. At an average annual spend on board games of $36, this would size the TAM at $576M.
We also previously narrowed our target market to be Christian families who use games in their homeschooling (playschooling). We estimated this to be around 85,000 families. However, from our research, we also identified that these families spend much more on games than the typical family. (We estimated 12 game purchases per year at an average price of $35.) That gives us a SAM of $36M.
If we aggressively pursue this market, we will carefully select marketing and sales channels to reach the Christian homeschool market. This likely would include homeschool conventions, homeschool websites and magazines, and homeschool bloggers. Playschooling families will likely spend most of their gaming budget on titles better aligned with core school subjects (math, language arts, history, other social sciences). Given these distribution and competitive challenges, we’d be doing really well to sell one game a year to 10,000 families. That would set our Serviceable Obtainable Market at $350,000.
Therefore, the market size for SDG Games can be represented by this simple diagram:
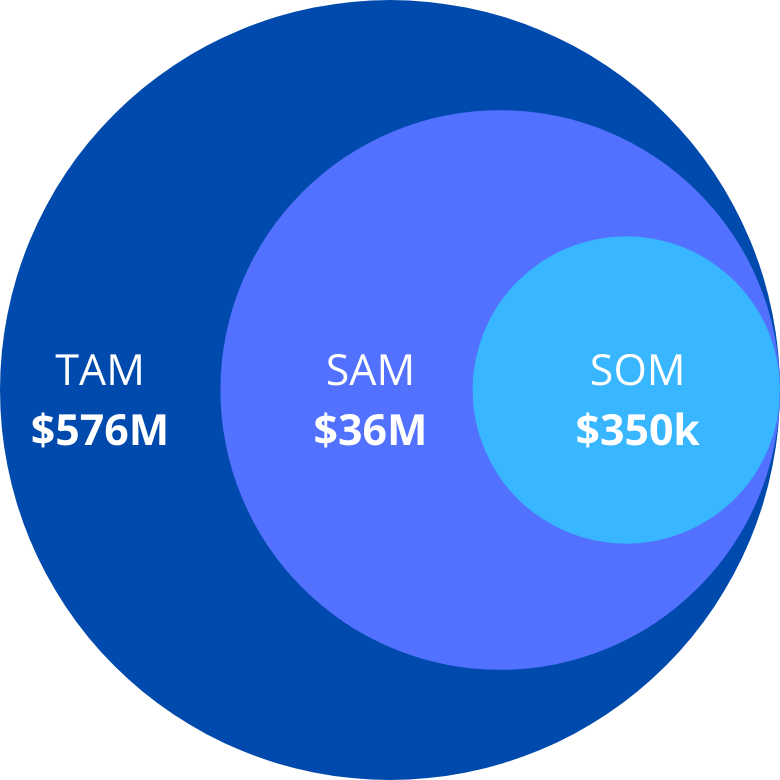
This market sizing information will help us to plan appropriately. We shouldn’t burden the business with more expenses than that market opportunity can support. It also gives us a sense for how much funding we could raise and the types of potential investors. We will speak more to that in coming articles.









 I believe that the next journey that Jesus took was from Jerusalem to Nazareth, still as a tiny baby. As I’ve said in previous posts, Jerusalem was in Judea in the south of Israel, while Nazareth was in Galilee in the north.